Infographics =
Information + graphics
Infographics let you present information in a visual way. They usually have a combination of words (called text) and pictures (called graphics or visuals). They are very useful, especially in business and in education, to help people (your customers!) understand data. This is especially important for things like numbers or technical (science) information that isn't so much fun to read (like stories).
In the class, we'll do a couple of lessons based on reading and understanding infographics.
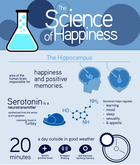
The first one we'll do is "The Science of Happiness."
Click HERE for the infographic. Your teacher will give you the tasksheet. HERE is the backup.
Information + graphics
Infographics let you present information in a visual way. They usually have a combination of words (called text) and pictures (called graphics or visuals). They are very useful, especially in business and in education, to help people (your customers!) understand data. This is especially important for things like numbers or technical (science) information that isn't so much fun to read (like stories).
In the class, we'll do a couple of lessons based on reading and understanding infographics.
The first one we'll do is "The Science of Happiness."
Click HERE for the infographic. Your teacher will give you the tasksheet. HERE is the backup.

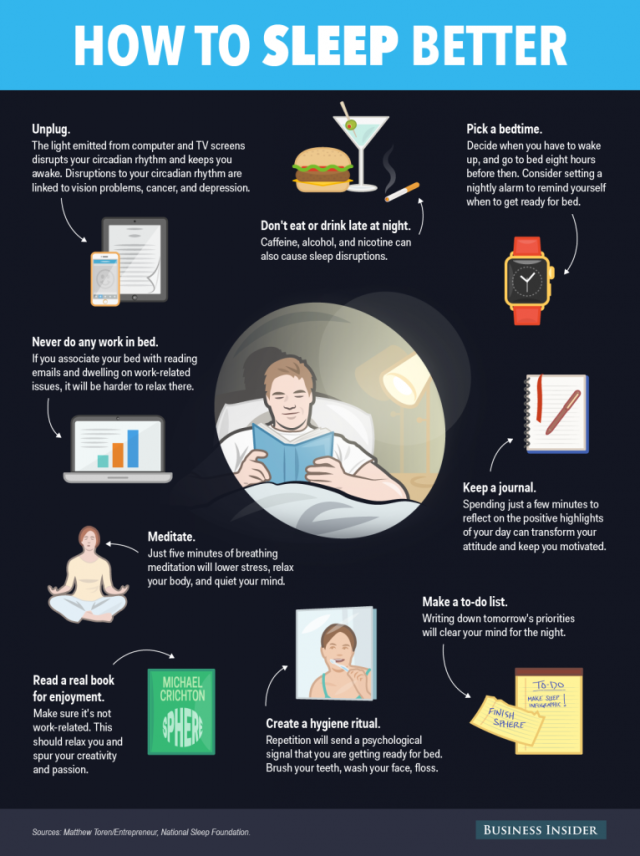
We'll also do Sleep and the Brain. Click HERE for the first infographic. I don't know why but sometimes that website doesn't work. If it doesn't click HERE for the backup.
The first infographic covers questions 1-7. For question 8 -- and ideas about how to sleep better, click HERE.
NOTE to teachers: You can download the tasksheet HERE. I suggest you print out the tasksheet for your students. The first infographic is quite long and jumping between windows will likely be counterproductive.